.png?fit=max&auto=format&n=j0cGklfibJAmmhG-&q=85&s=af847c42317733e0420a6c0f86e807c8)
Stats Panel
At the top-left, the stats panel summarizes your overall trading performance:PnL Chart
The PnL Chart visualizes your cumulative profit and loss over time.Click the calendar icon in the top-right of the chart to open the PnL Calendar - a monthly view that shows your daily trading results, color-coded by gain (green) or loss (red). It also highlights your Best Positive Streak for the month.
Portfolio Widget
The panel on the right shows your current portfolio snapshot:- Total Portfolio Value - combined value of all token holdings plus your SOL balance
- Token Balance - number of tokens held and their total USD value
- SOL Balance - available SOL in your wallet
- Token Allocation - donut chart showing how your portfolio is distributed across tokens
Tabs
Token Holdings
The Token Holdings tab shows all tokens you currently hold or have held, with the following columns:Click Burn Token in the Token Holdings tab to instantly convert small token balances that are too small to sell into SOL. This keeps your wallet clean and clutter-free.
.png?fit=max&auto=format&n=j0cGklfibJAmmhG-&q=85&s=66aea91048aa3ea45f185bffff9c4125)
Token Performance
The Token Performance tab ranks all the tokens you’ve traded by their realized PnL, making it easy to identify your best and worst performers..png?fit=max&auto=format&n=j0cGklfibJAmmhG-&q=85&s=65790be2a2dde9425a2bb9491b9f9d4a)
Trader Activity
The Trader Activity tab shows a chronological log of every trade you’ve made. Each row includes:.png?fit=max&auto=format&n=j0cGklfibJAmmhG-&q=85&s=b29f963e5617af0c922cb6abff1cb8a2)
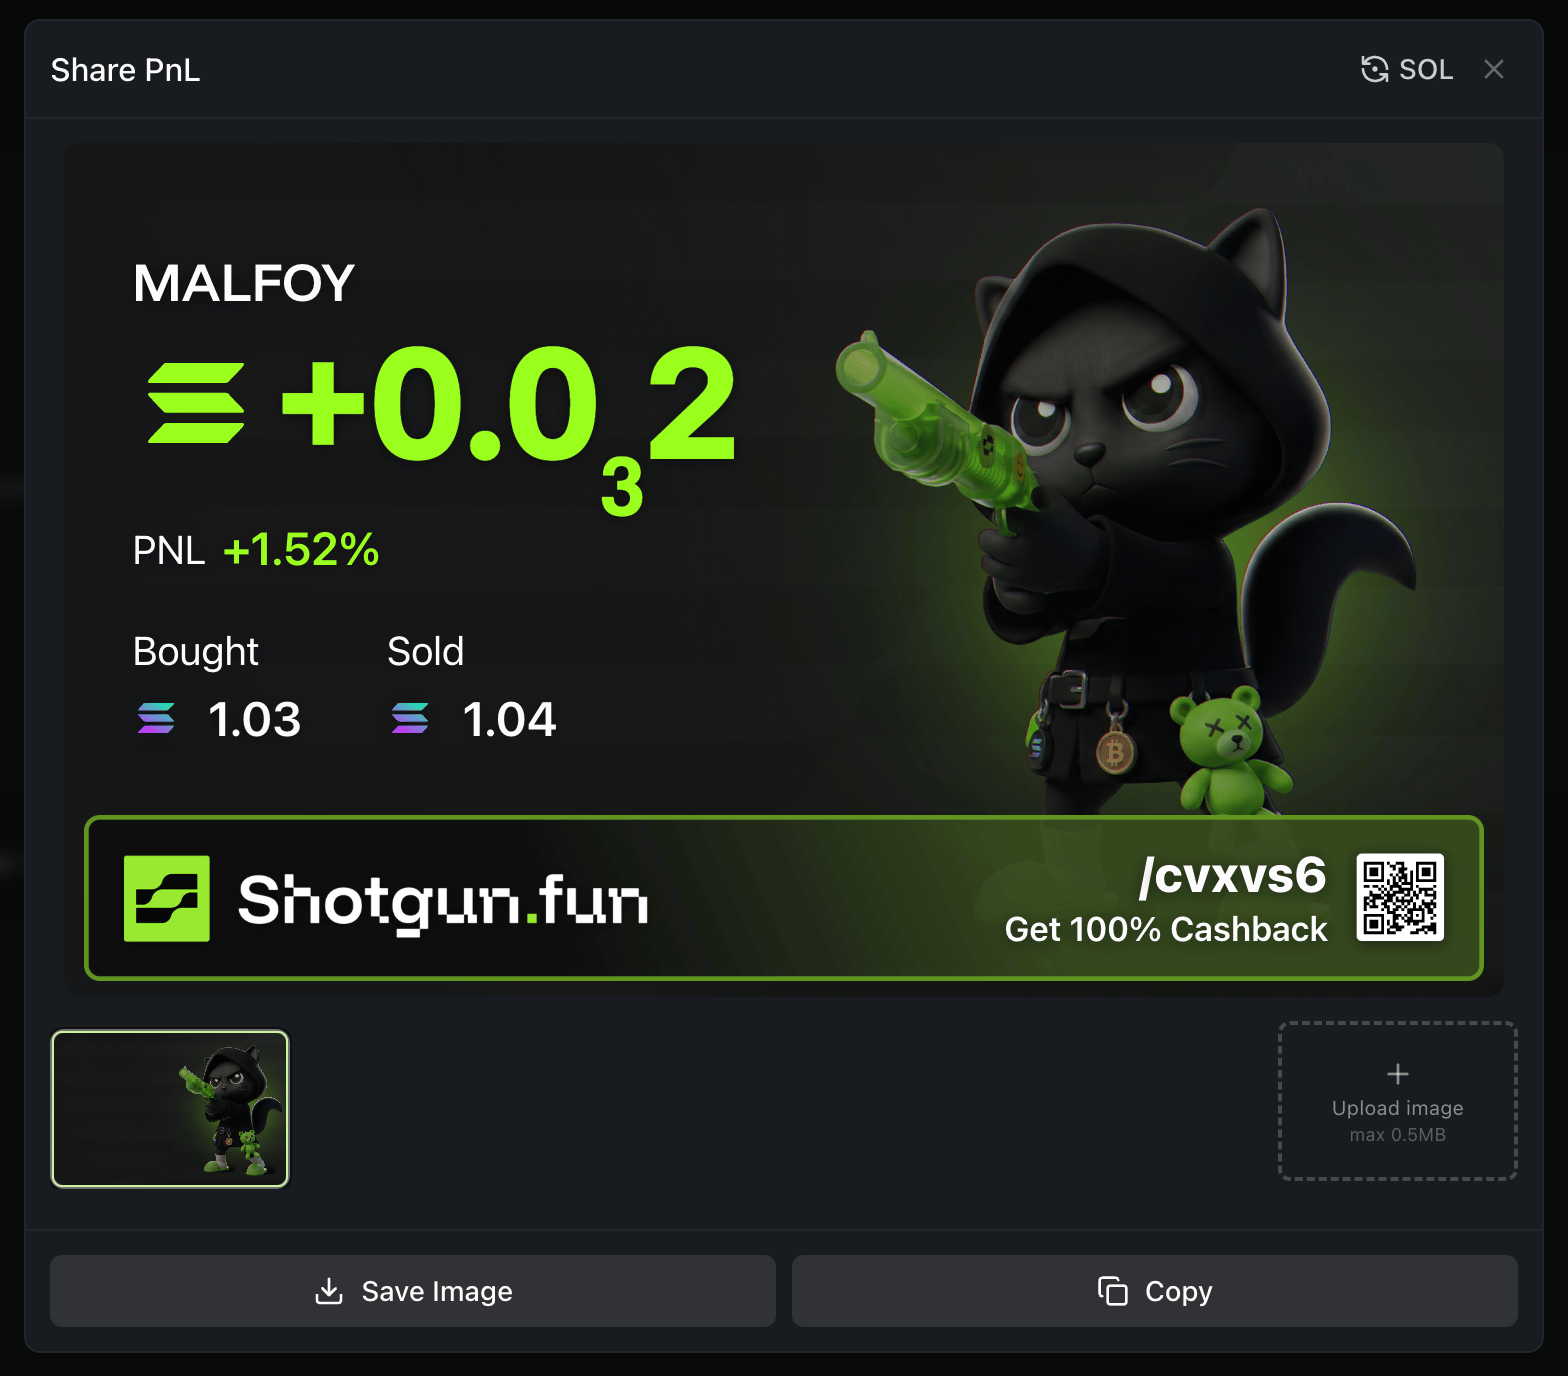
Share Your PnL
Click the share icon on any token row to generate a shareable PnL card.